The consensus pointed out that the month of May was going to be the month in which a downward trend in American inflation began. We were wrong.
What has become more expensive?
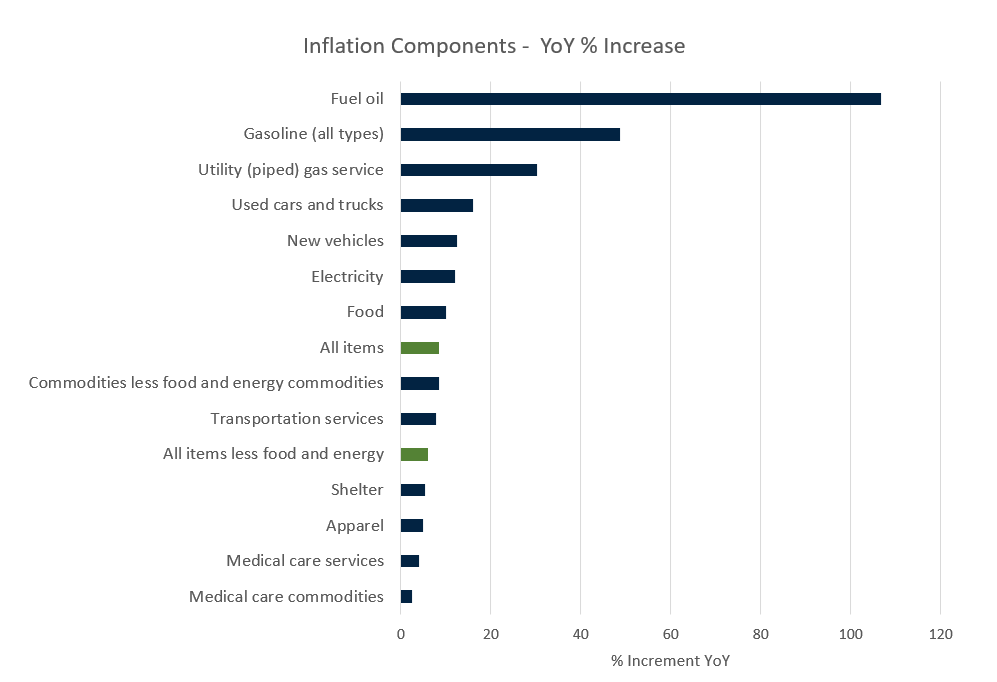
To know the answer we just have to look at the following graph
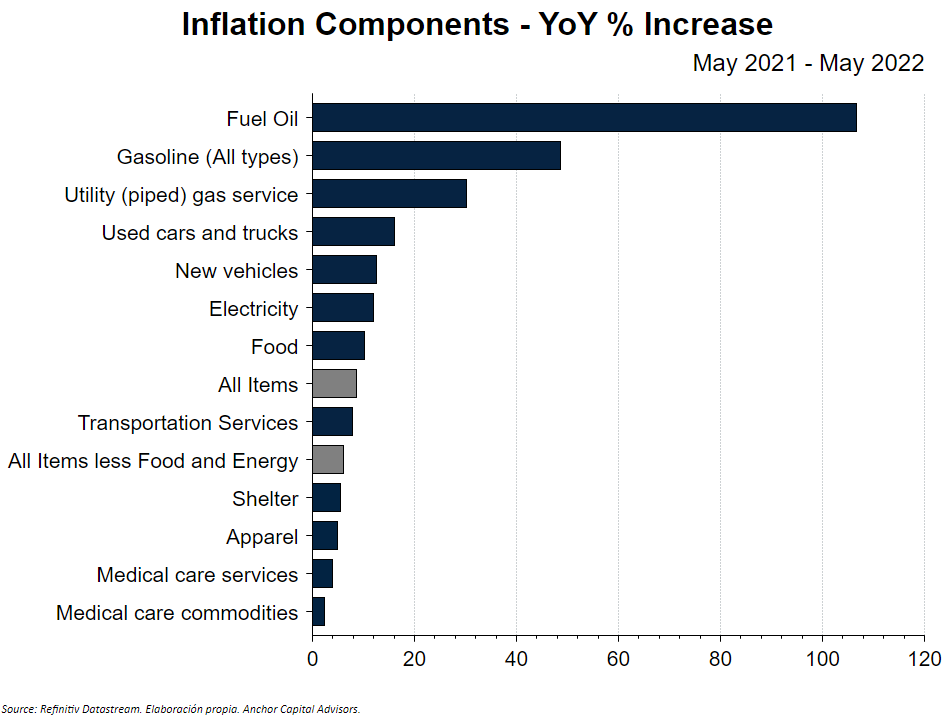
Apart from the brutal increase in energy, it is worth noting the increase in cars, both used and new, with increases of more than 15%.
In addition, other elements such as plane tickets (+38%), eggs (+32%), milk (+16%), or chicken (+17.4%) have suffered significant increases.
The technology, deflationary
By contrast, technological products have a significant deflationary component: we can buy the same goods as last year but at a lower price. An example is smartphones, where the price has dropped in the order of 15%-20% this year.
How long will it last?
That is the question everyone is asking. Anyway, if we look at the price indices, we see that for many products (such as energy), the base effect starts to unravel at the beginning of the year 2023. For this reason, we will still see high price increases during, at least, this summer.