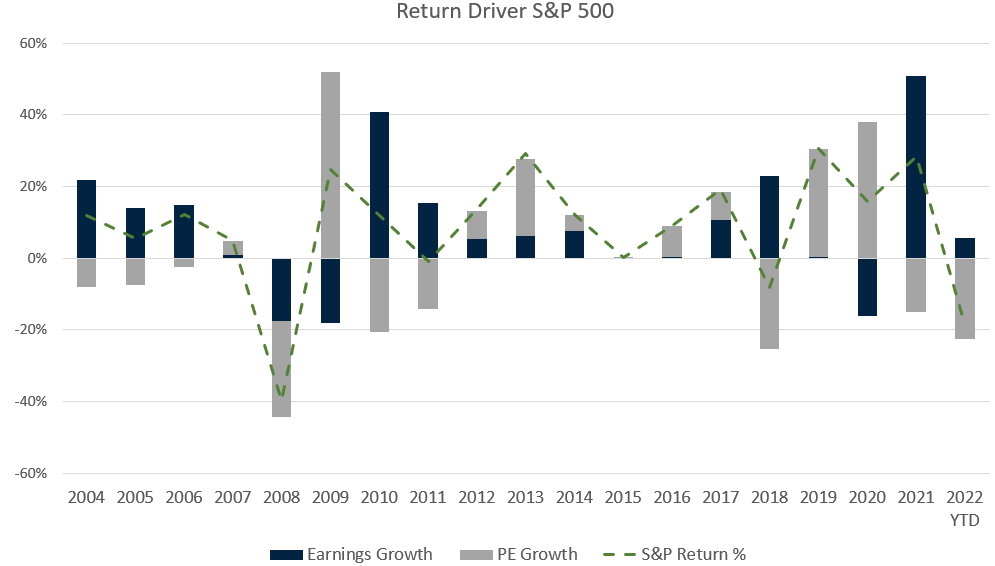
Investing in the stock market is a combination of sentiment and numbers. In the following graph, we can see the implication of the PE multiple and Earnings per Share (EPS) in the performance of the S&P 500:
What is happening this year?
Just as 2019 was a year where we saw no earnings growth but multiple expansion helped by a small drop in interest rates from the FED, in 2022 we are experiencing the opposite scenario.
Despite seeing EPS increases due to the good health of companies, the multiple is correcting at a fast pace. It's no secret that rate hikes triggered by high inflation are driving down the price (and hence higher future returns) of stocks whether earnings hold or grow.
Revert to a normalized multiple
Massive liquidity injections through monetary policy, fiscal stimulus and low rates triggered high prices in financial markets.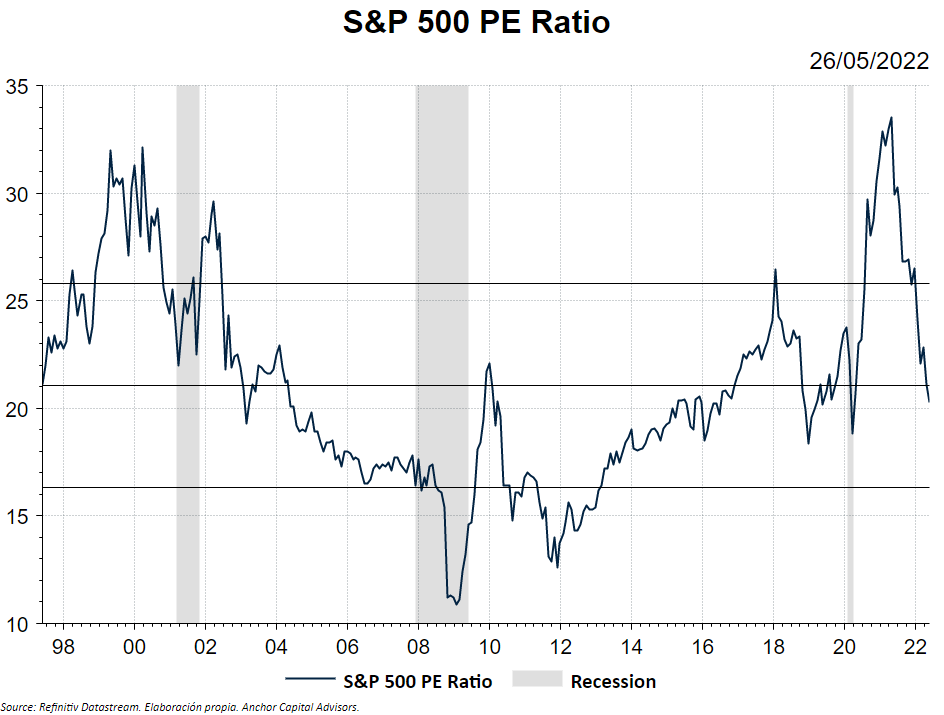
Once the bonanza is over, we should return to a situation of relative "normality". As we can see in the graph, the multiple of the American stock market is already at its historical average.
Recession?
In addition to the multiple compression, we could add the possible negative effects on the EPS in the hypothetical case of a recession.
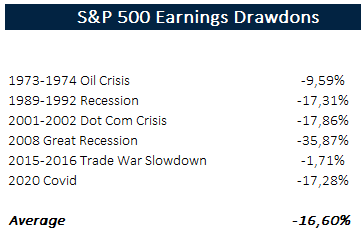
If so, we could still see big falls in stocks: if earnings fall by 10% (recession scenario), we are likely to see multiples decline as well, so further declines would exceed 15%.
Are we prepared for the worst?
Although making predictions about the future is risky, it is always good to put on the table the possible scenarios that we face. In this way we can see in a numerical way, although approximate, how much our portfolios would fall in a recession scenario.