In the graph below, we can see the PE multiple correlated with the S&P 500, ten years later. In other words, we buy at a certain multiple and then we wait ten years to see the result. The objective is to see whether buying at a cheap multiple pays off.
Surely, many of us have seen the graphic in a social network.
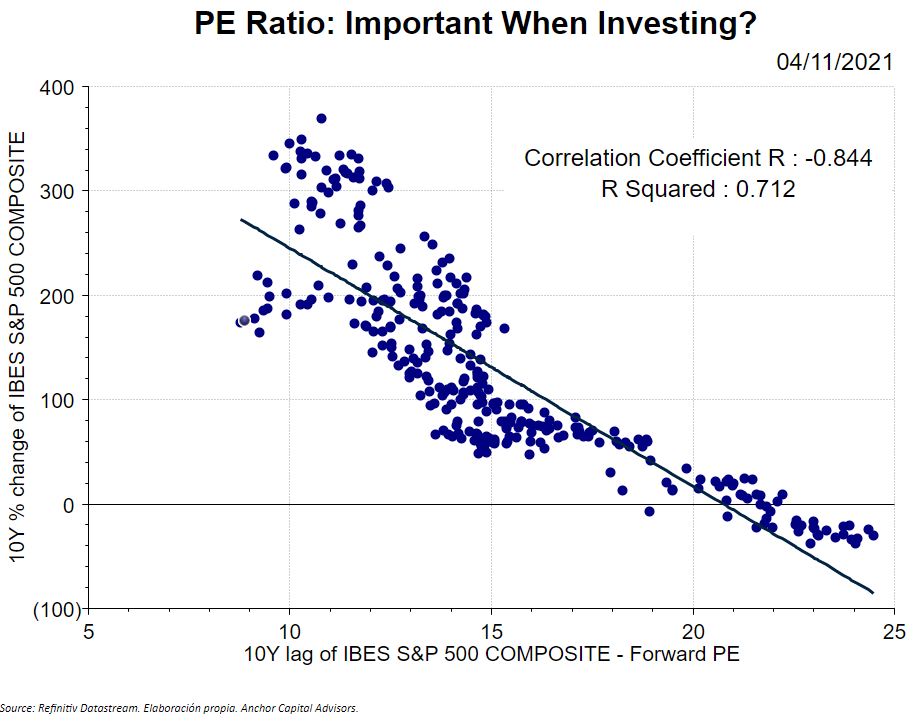
Apparently, the relationship seems to be clear: when we buy at a lower multiple, our profit, after ten years, is greater. In other words, buying cheap pays off ten years later. Or at least that is what has happened historically.
Is it a causal relationship?
In any case, we cannot affirm that it is a causal relationship. We have several arguments to support this theory:
- Autocorrelation: the data is autocorrelated. It is not a good sign for searching causality.
- Residuals: as we see in the graph, there are empty areas of points. This is indicating that the relationship might not be entirely causal, since the points would have to be symmetrically distributed, both above and below the line.
- Period Selection: since 1995 we have seen three crises separated by 10 years, which indicates that another choice of the period could give us completely different data.
- The multiple determines the profit: mathematically, the PE Ratio formula includes the index price, which in turn determines the ten-year return. Therefore, doing a regression between the two variables can be tricky.
Conclusion: don't be fooled by graphics
Although historical data is relevant, we are only taking into account one part of the equation. Here, we should also take into account the earnings growth, which also affects the price and, consequently, the multiple, and the interest rates, among other variables.
To conclude, we can say that depending on a single variable in such a complex market can be tricky. In any case, what we cannot do is to throw the PE multiple in the trash. The important thing, as in many other aspects, is to know how to use it wisely.